Overview
This is a trading research app project whose mission is to allow casual and professional traders to dive deep into what goes behind price movements and to better educate them on what assets to trade.
Objective
The objective is to create a web app for trading research that should give deep insight to the users into what assets to trade. It should be a swiss-knife of trading research.
The Scope
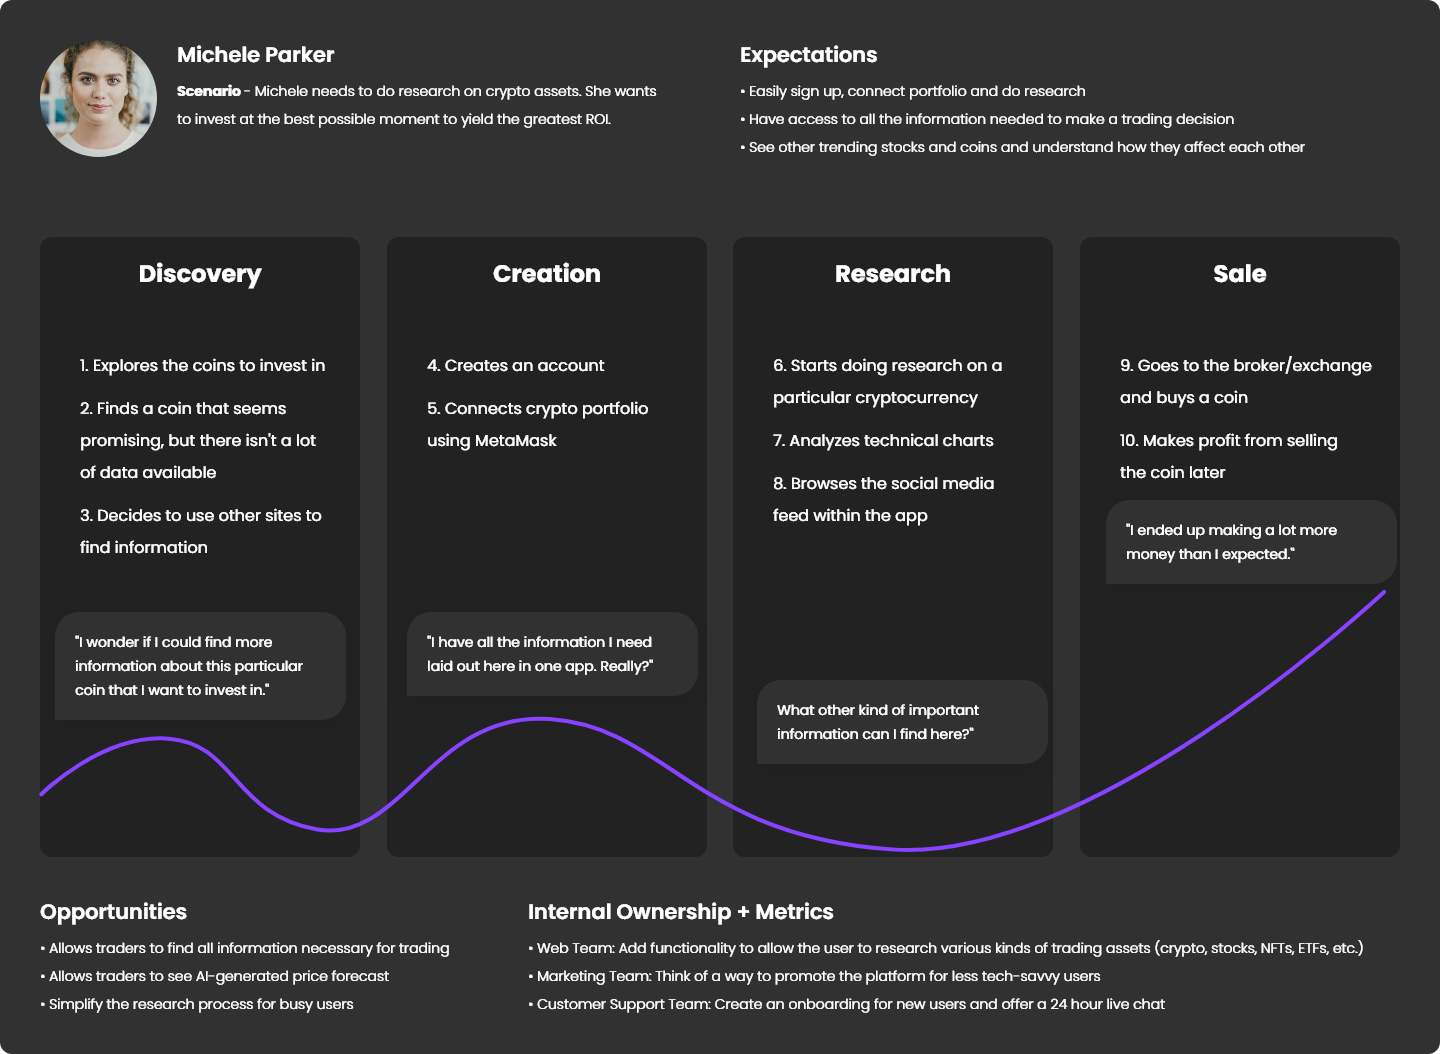
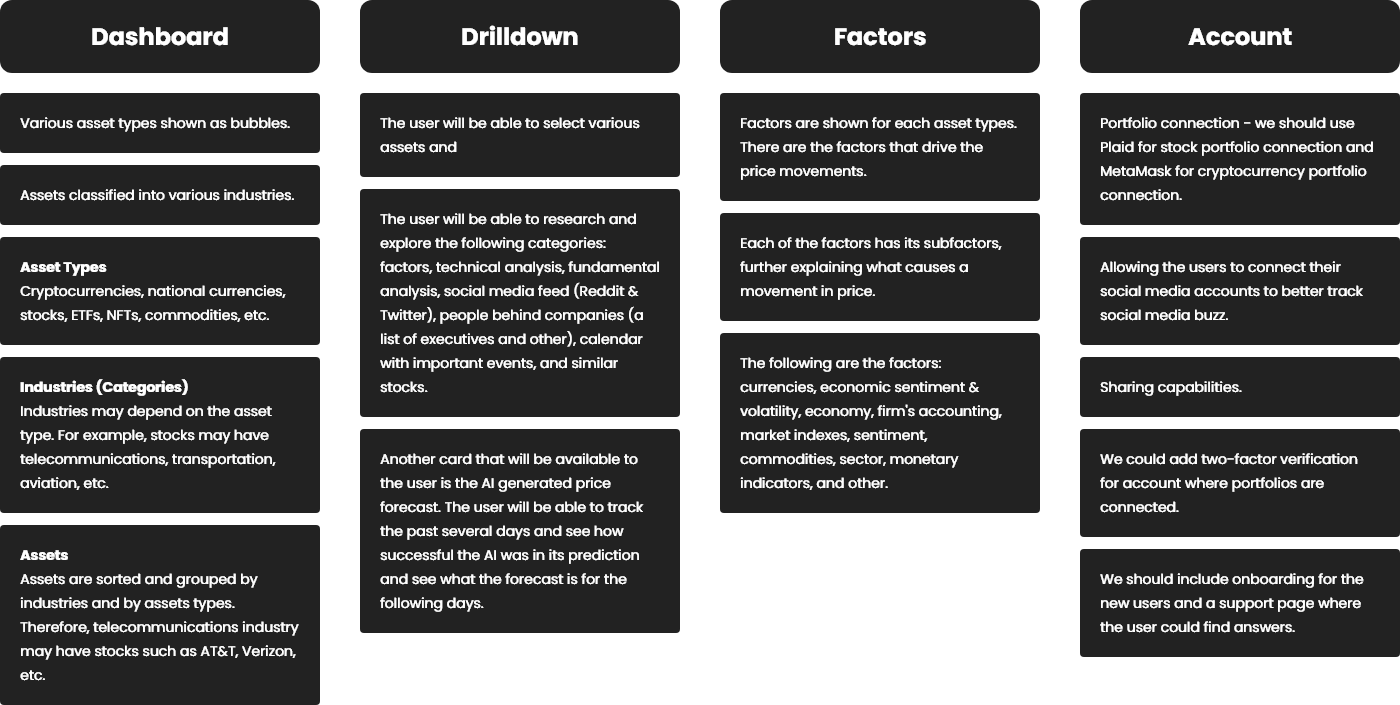
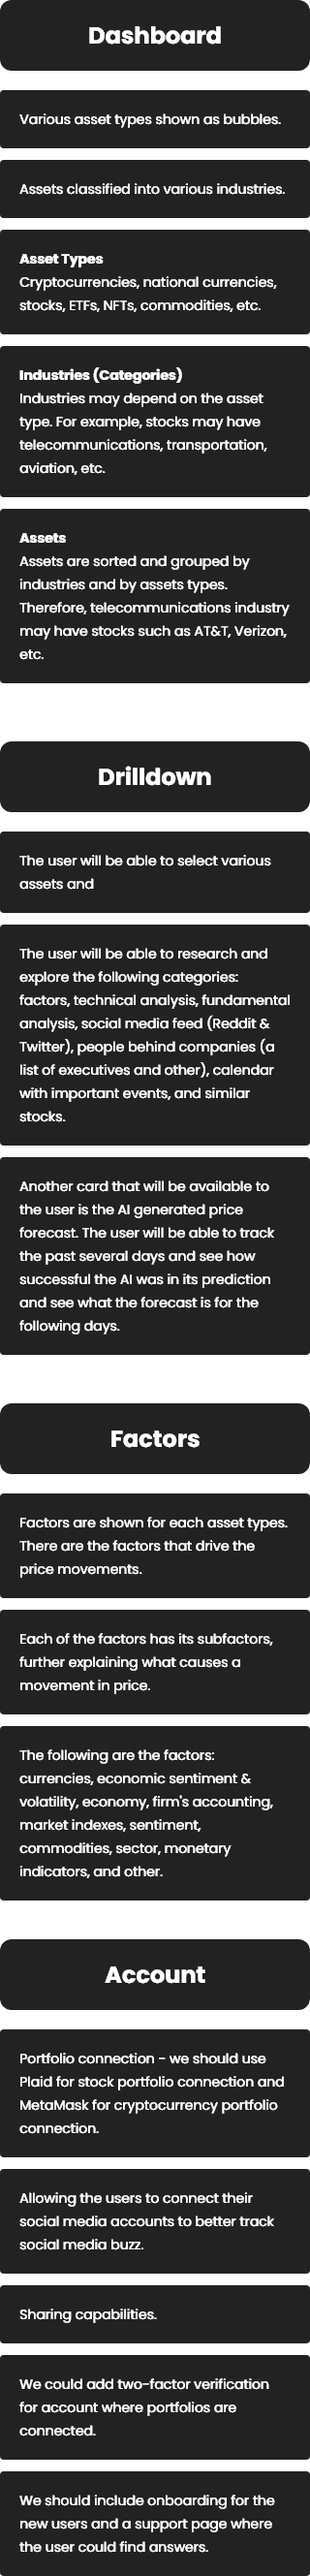
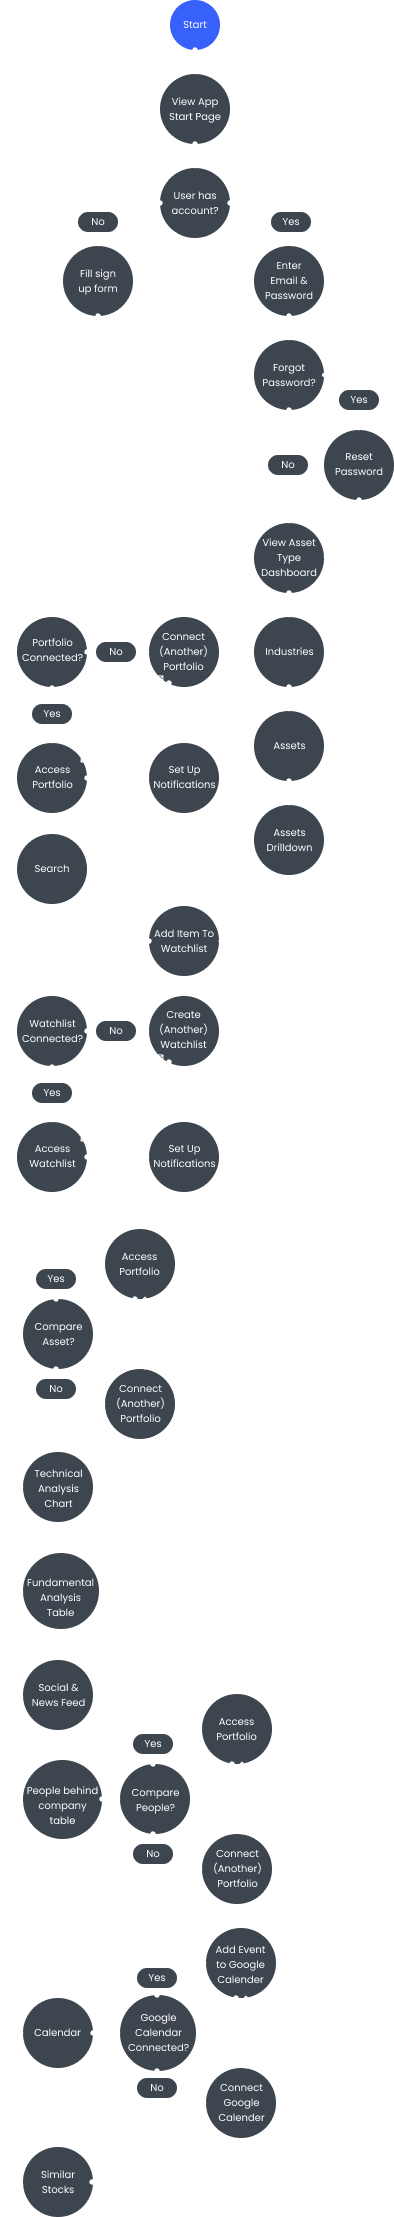
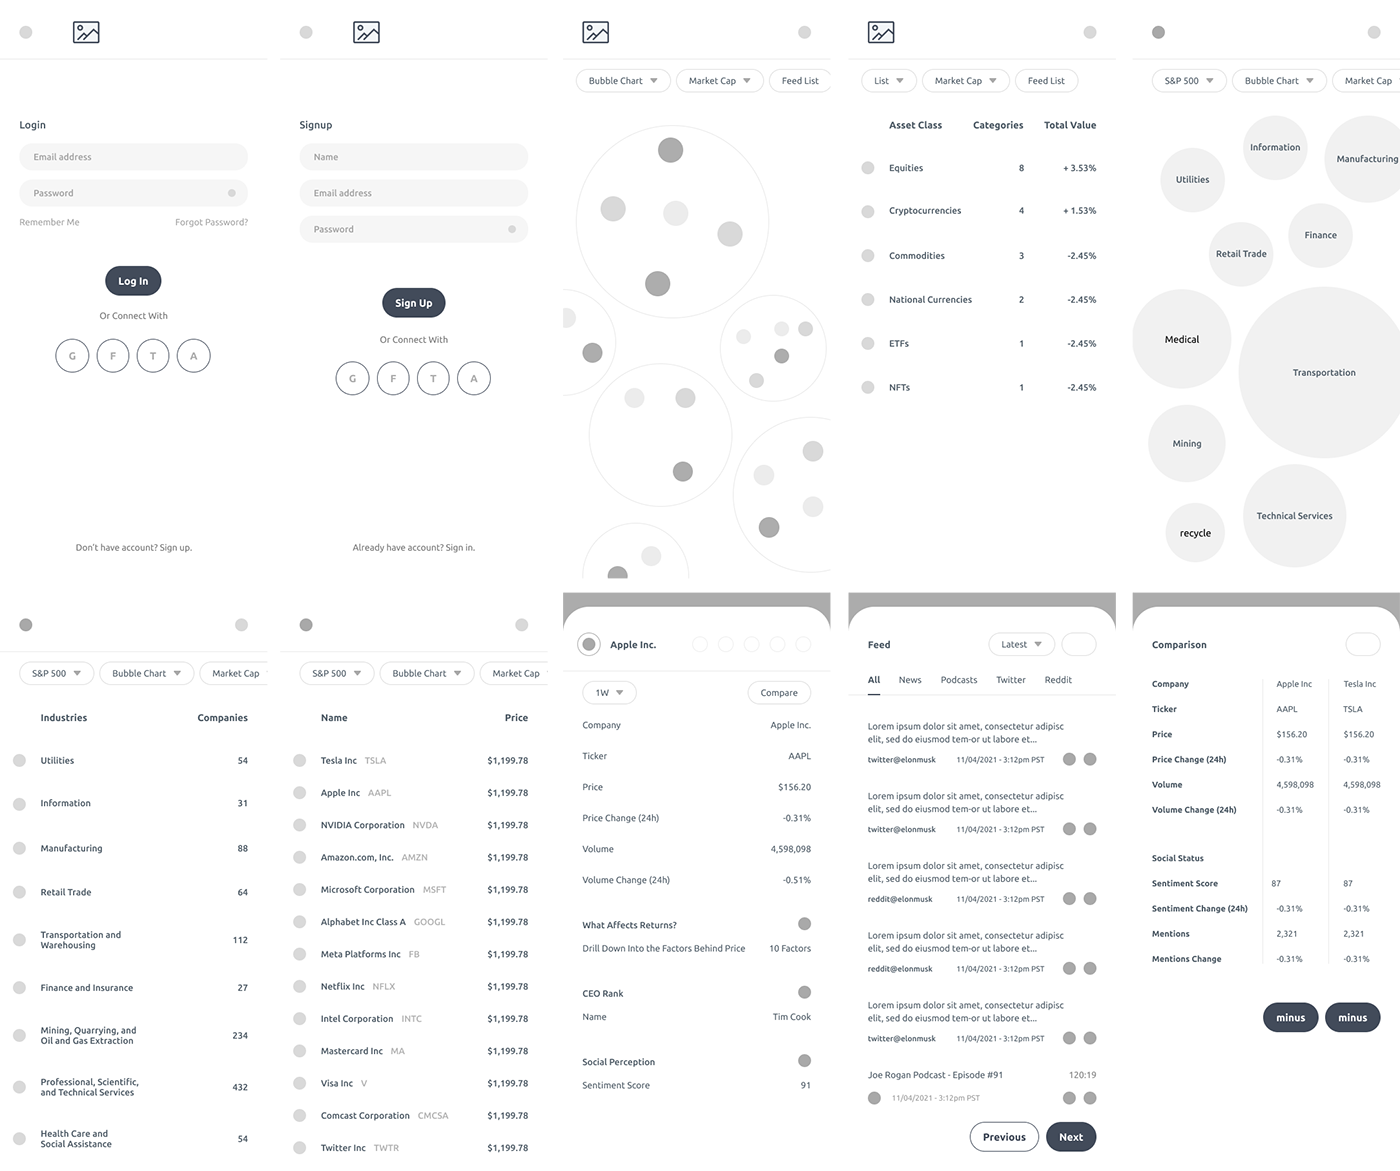
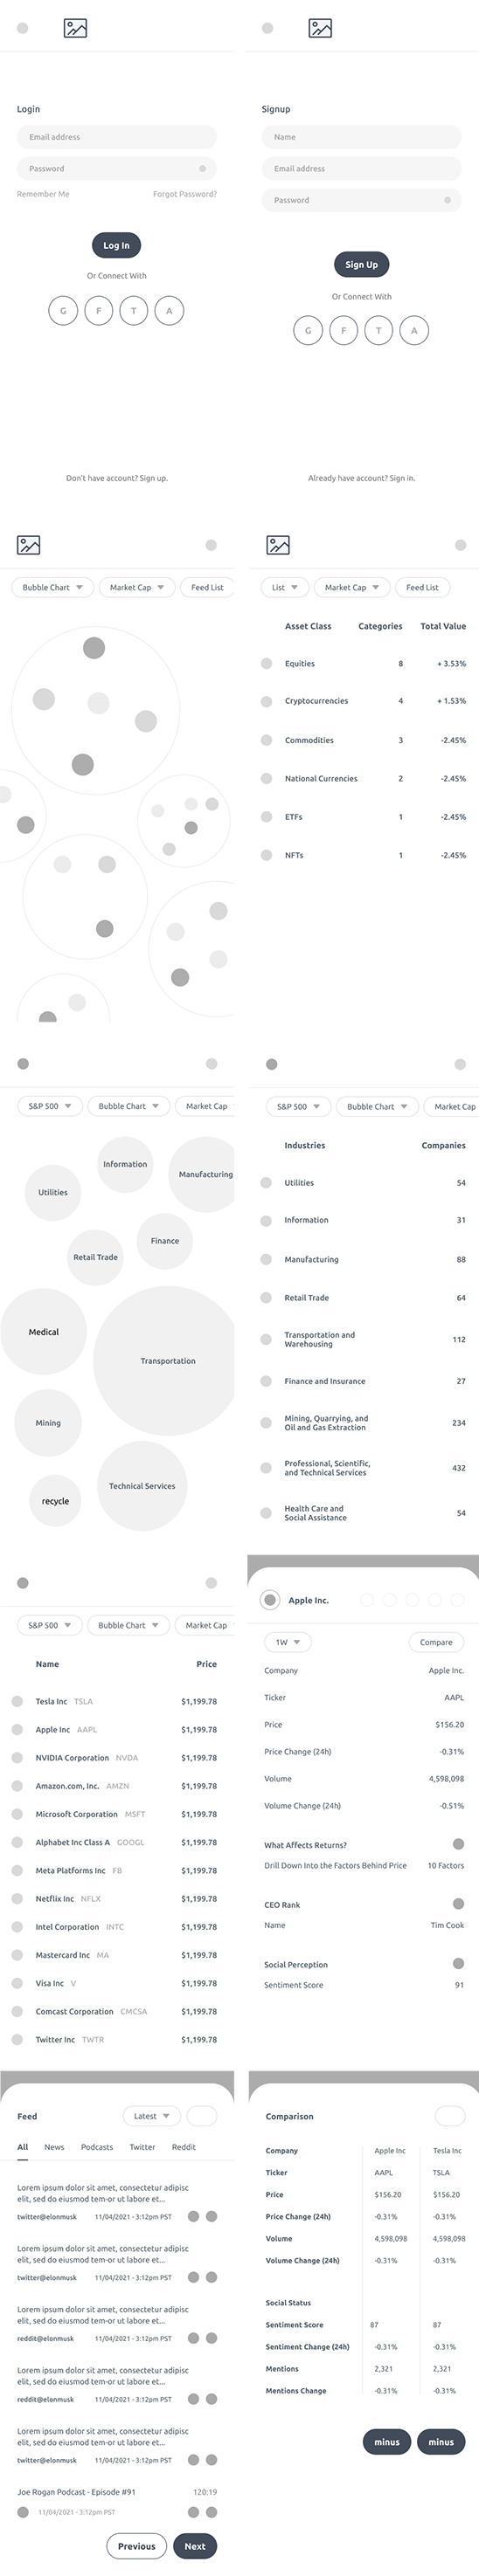
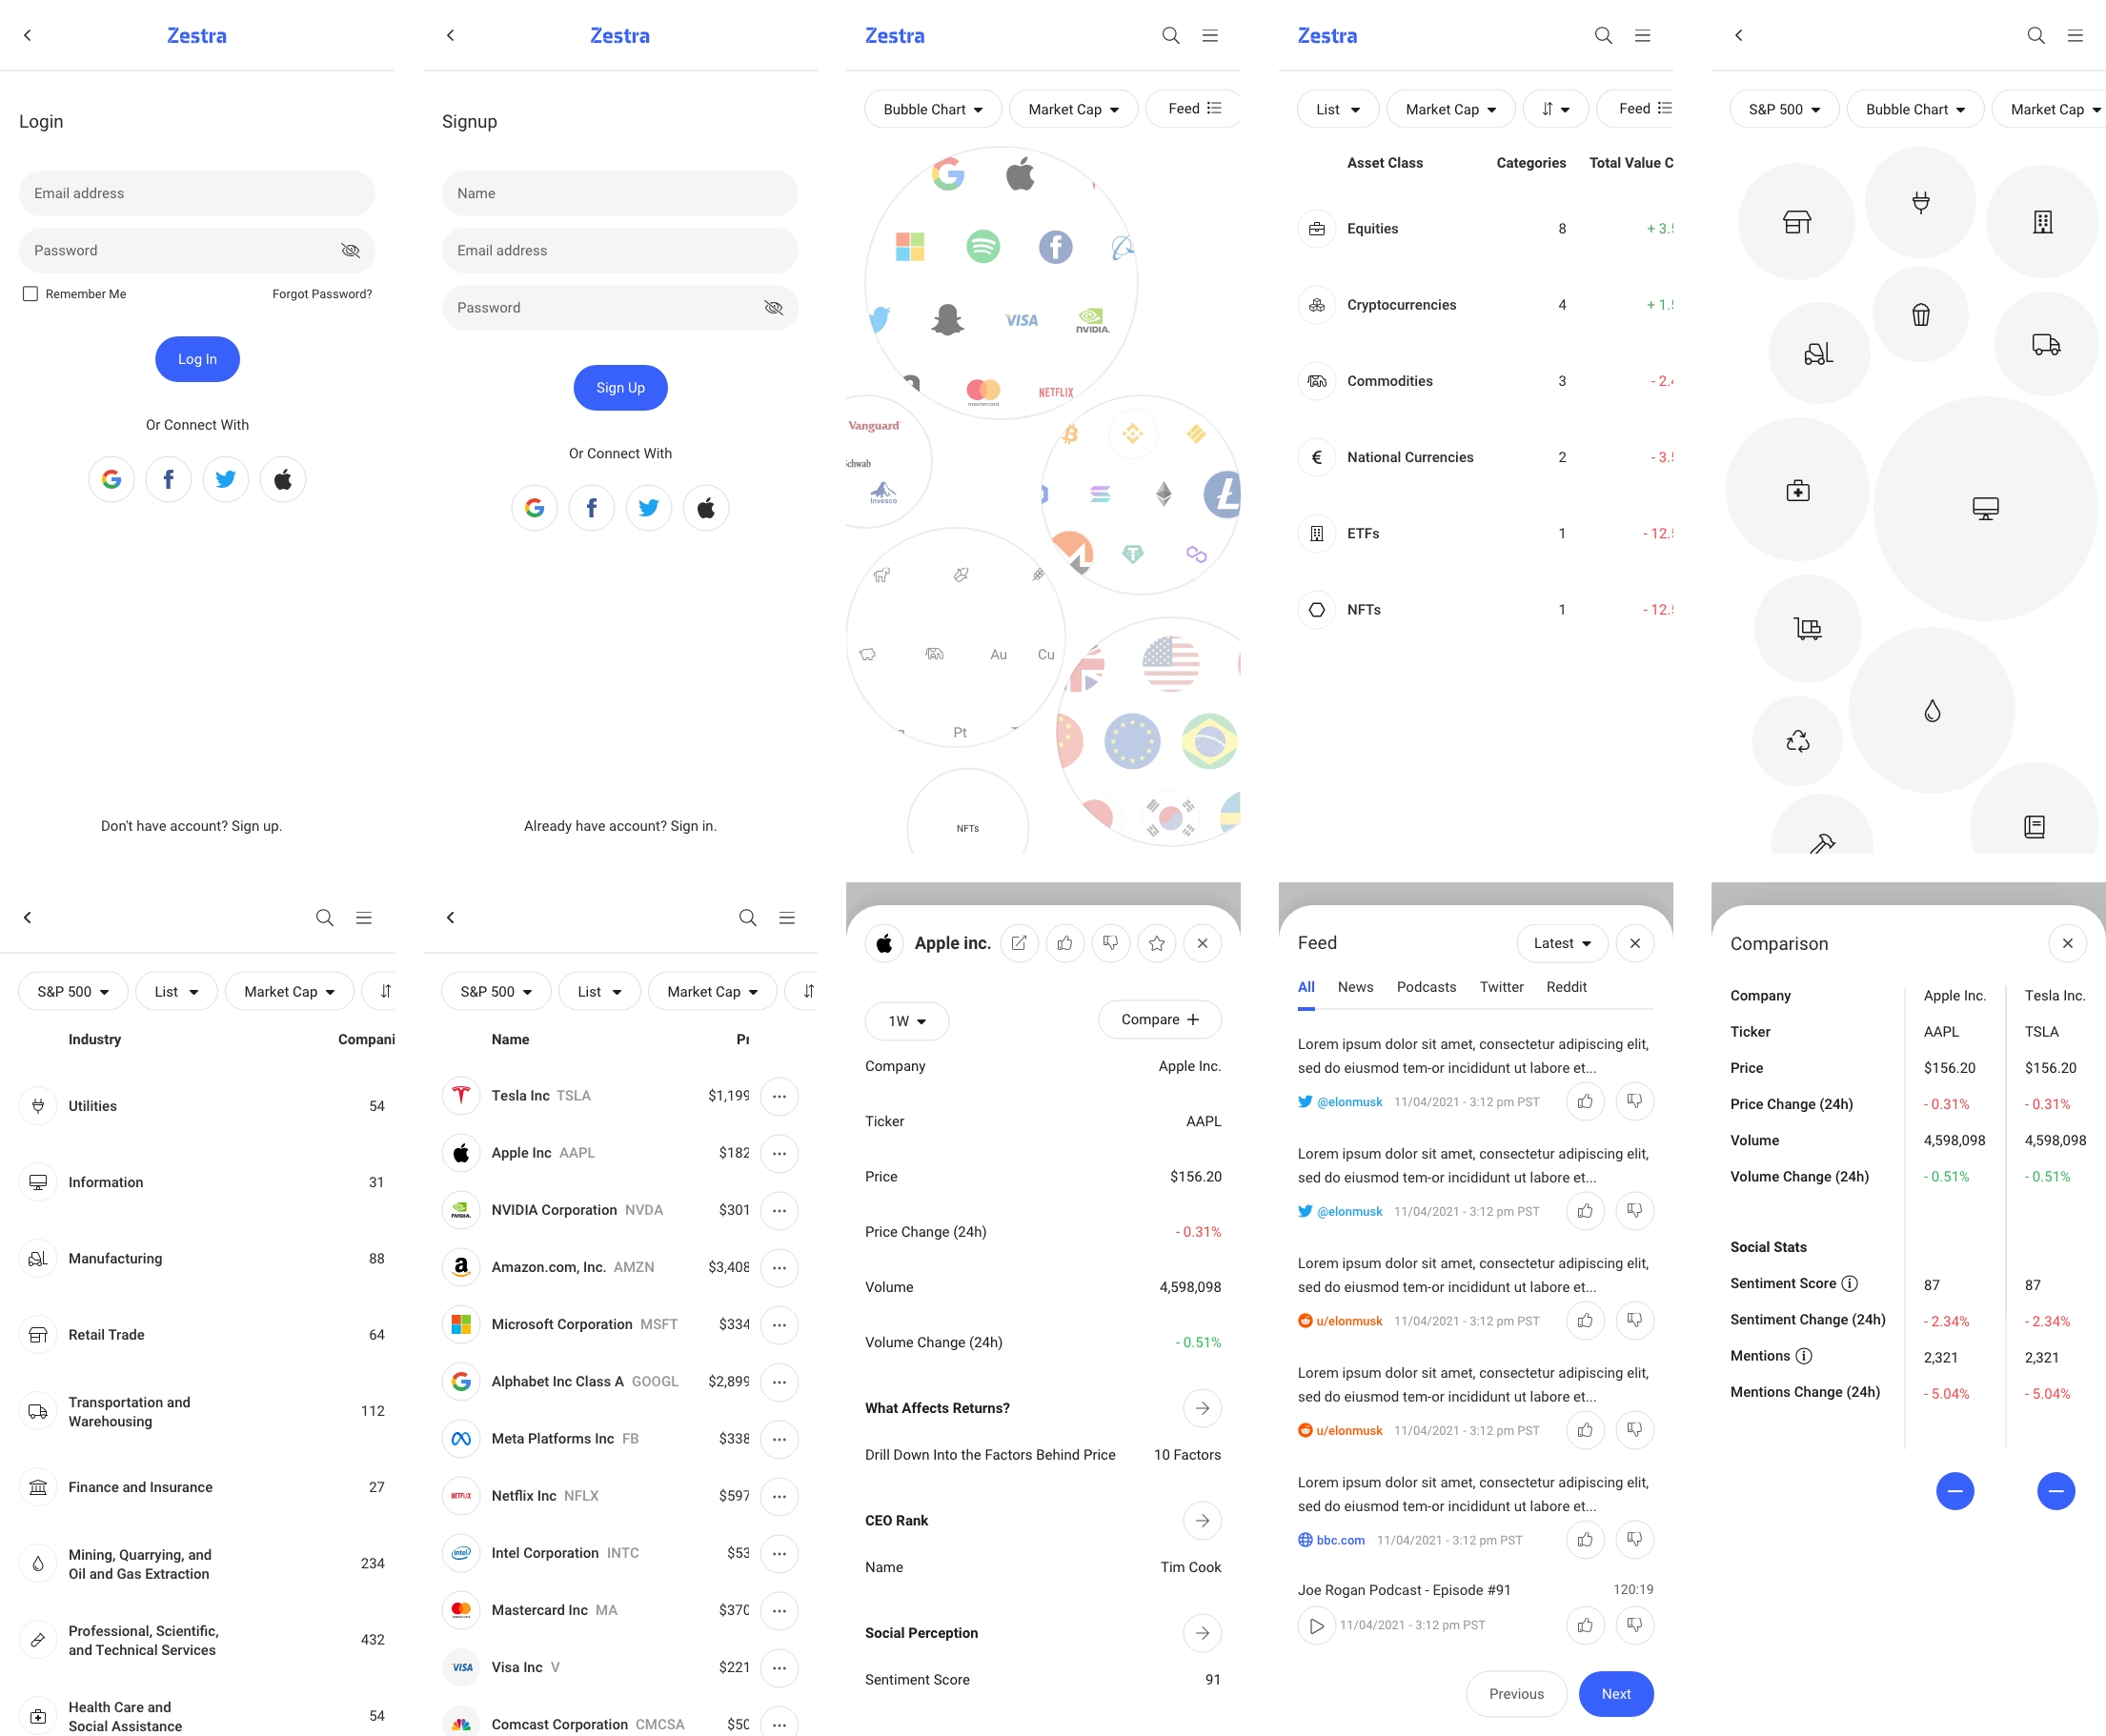
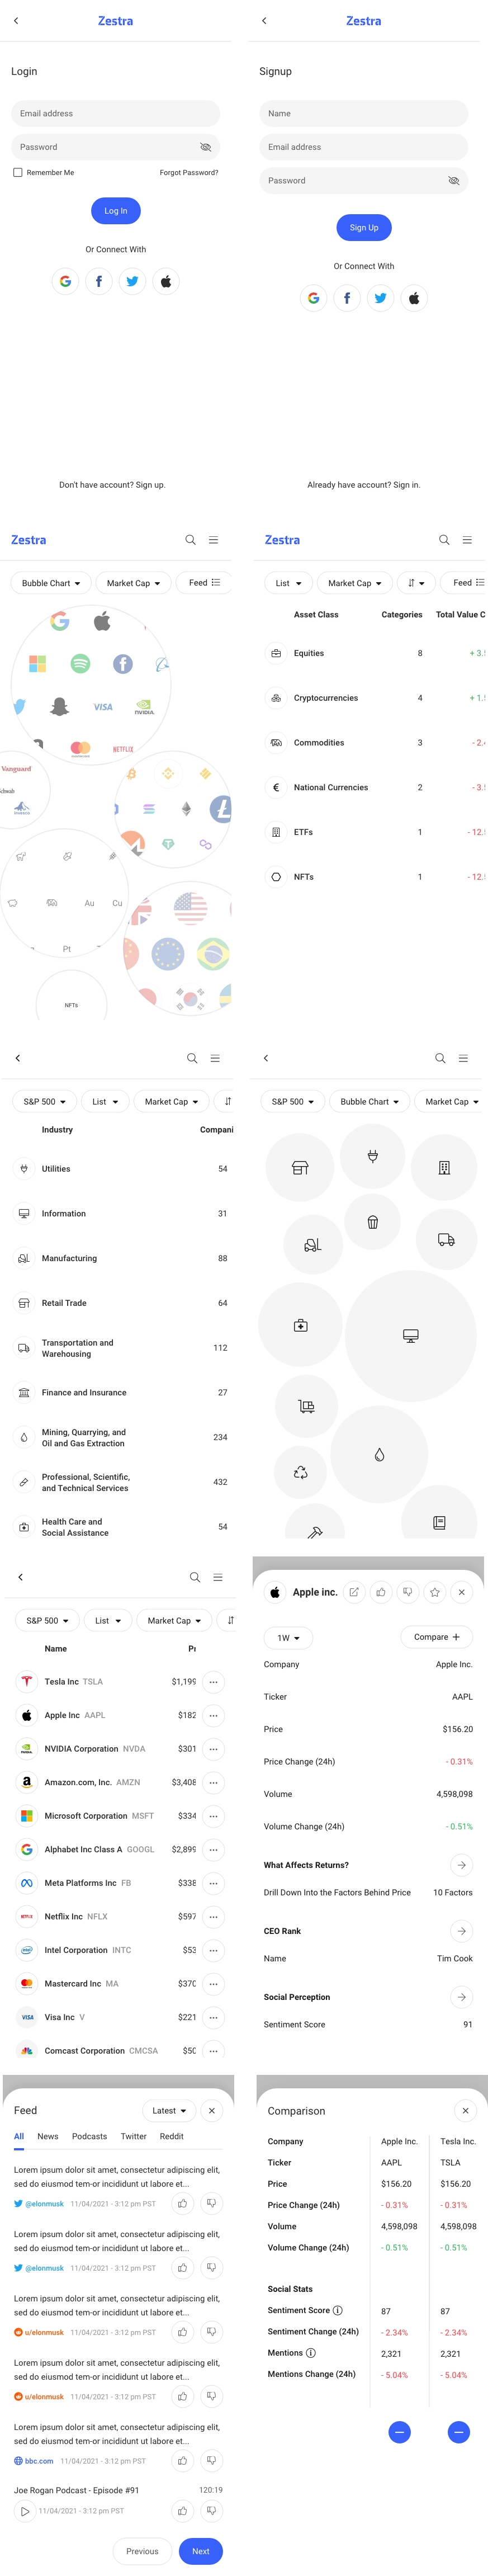
The app should allow the users to look up different types of assets (stocks, cryptocurrencies, utility tokens, ETF, NFTs, commodities, and national currencies). Furthermore, the app should include technical analysis section, fundamental analysis section, social and news media feed focused on tradeable assets, a section with people behind the company, and a section with calendar of important events such as earnings reports. Additionally, the app should include a portfolio that would be connected to a 3rd party app, watchlists, and an ability to compare companies or CEOs.
Out of The Scope
Down the road, the app is imagined to include price prediction based on sentiment and previous price movements as well as the ability to trade assets directly within the app. However, due to tight schedule, these functionalities were left for future iterations.
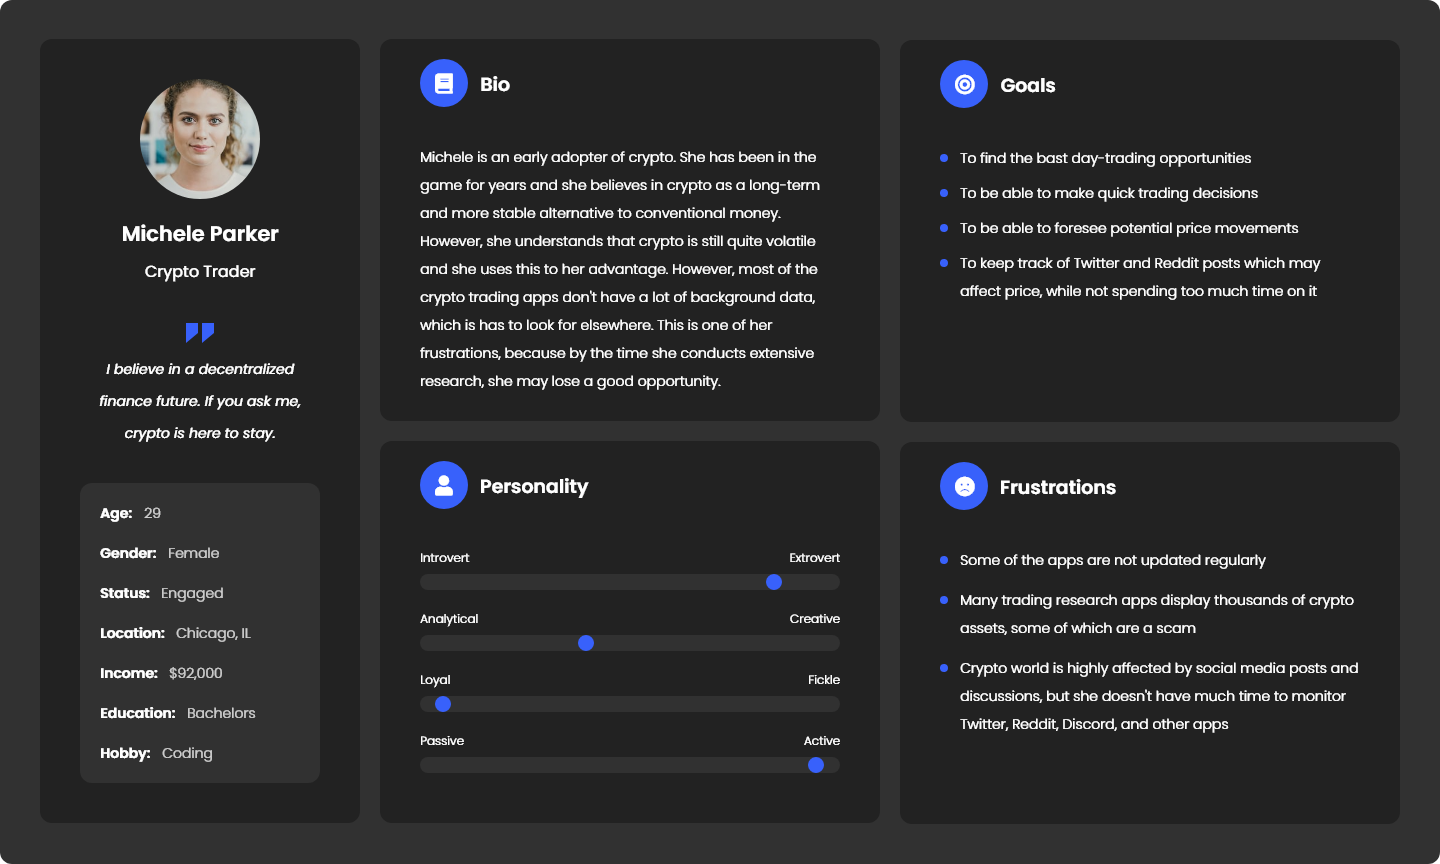
Target Audience
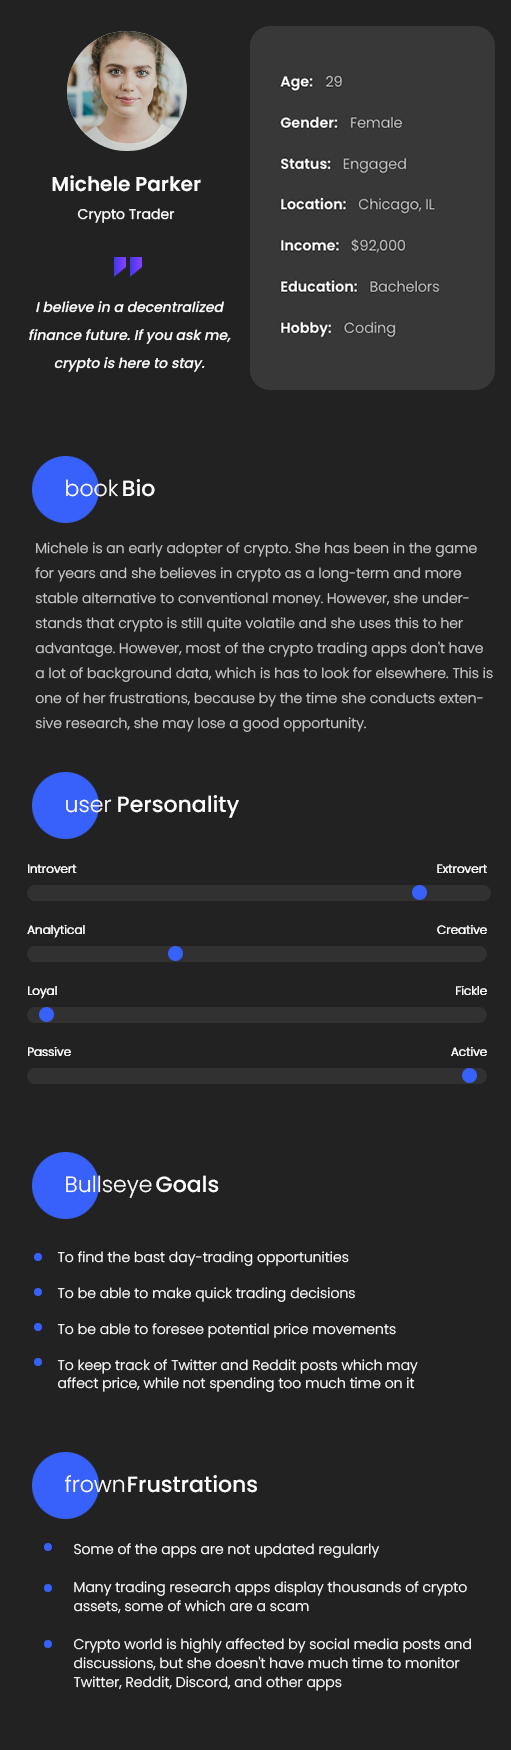
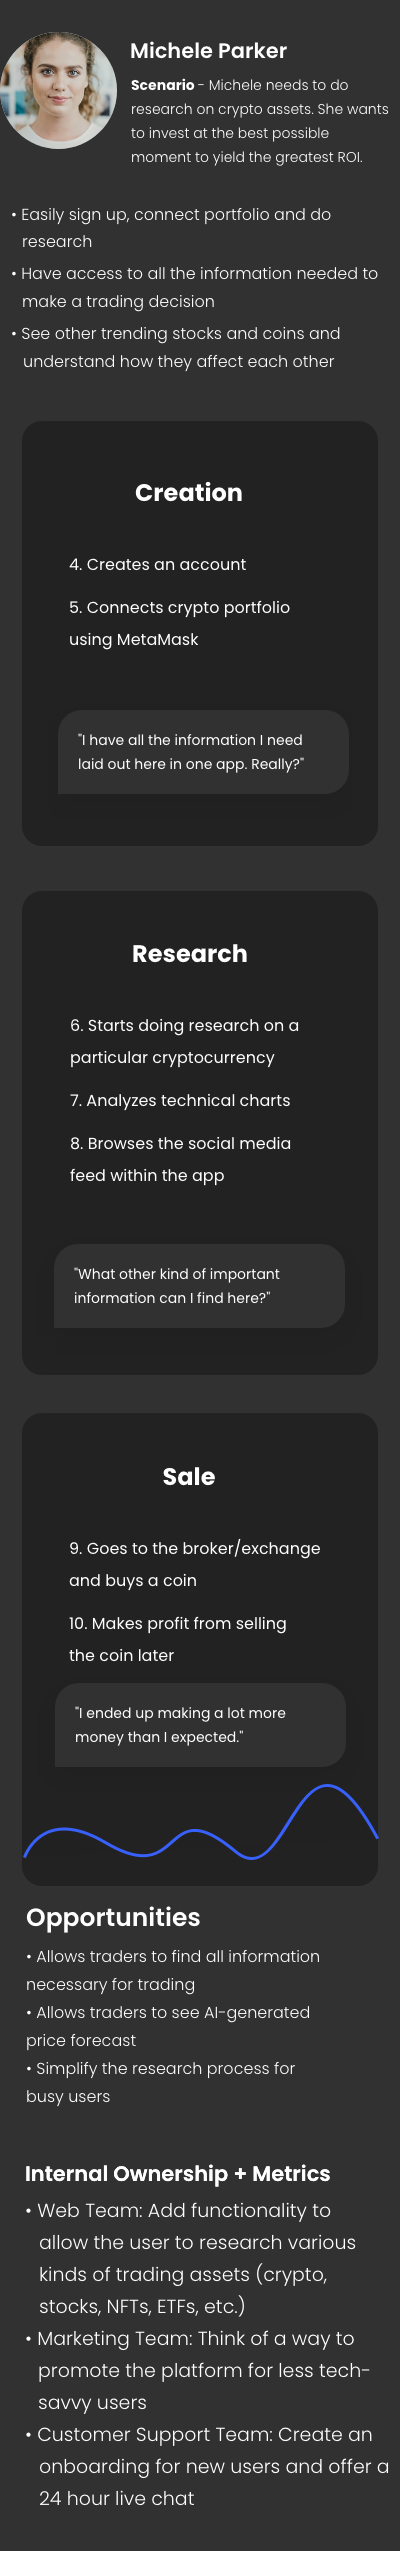
Target audience consists of traders, hedge funds, family offices, and wealth managers.
Core User Needs
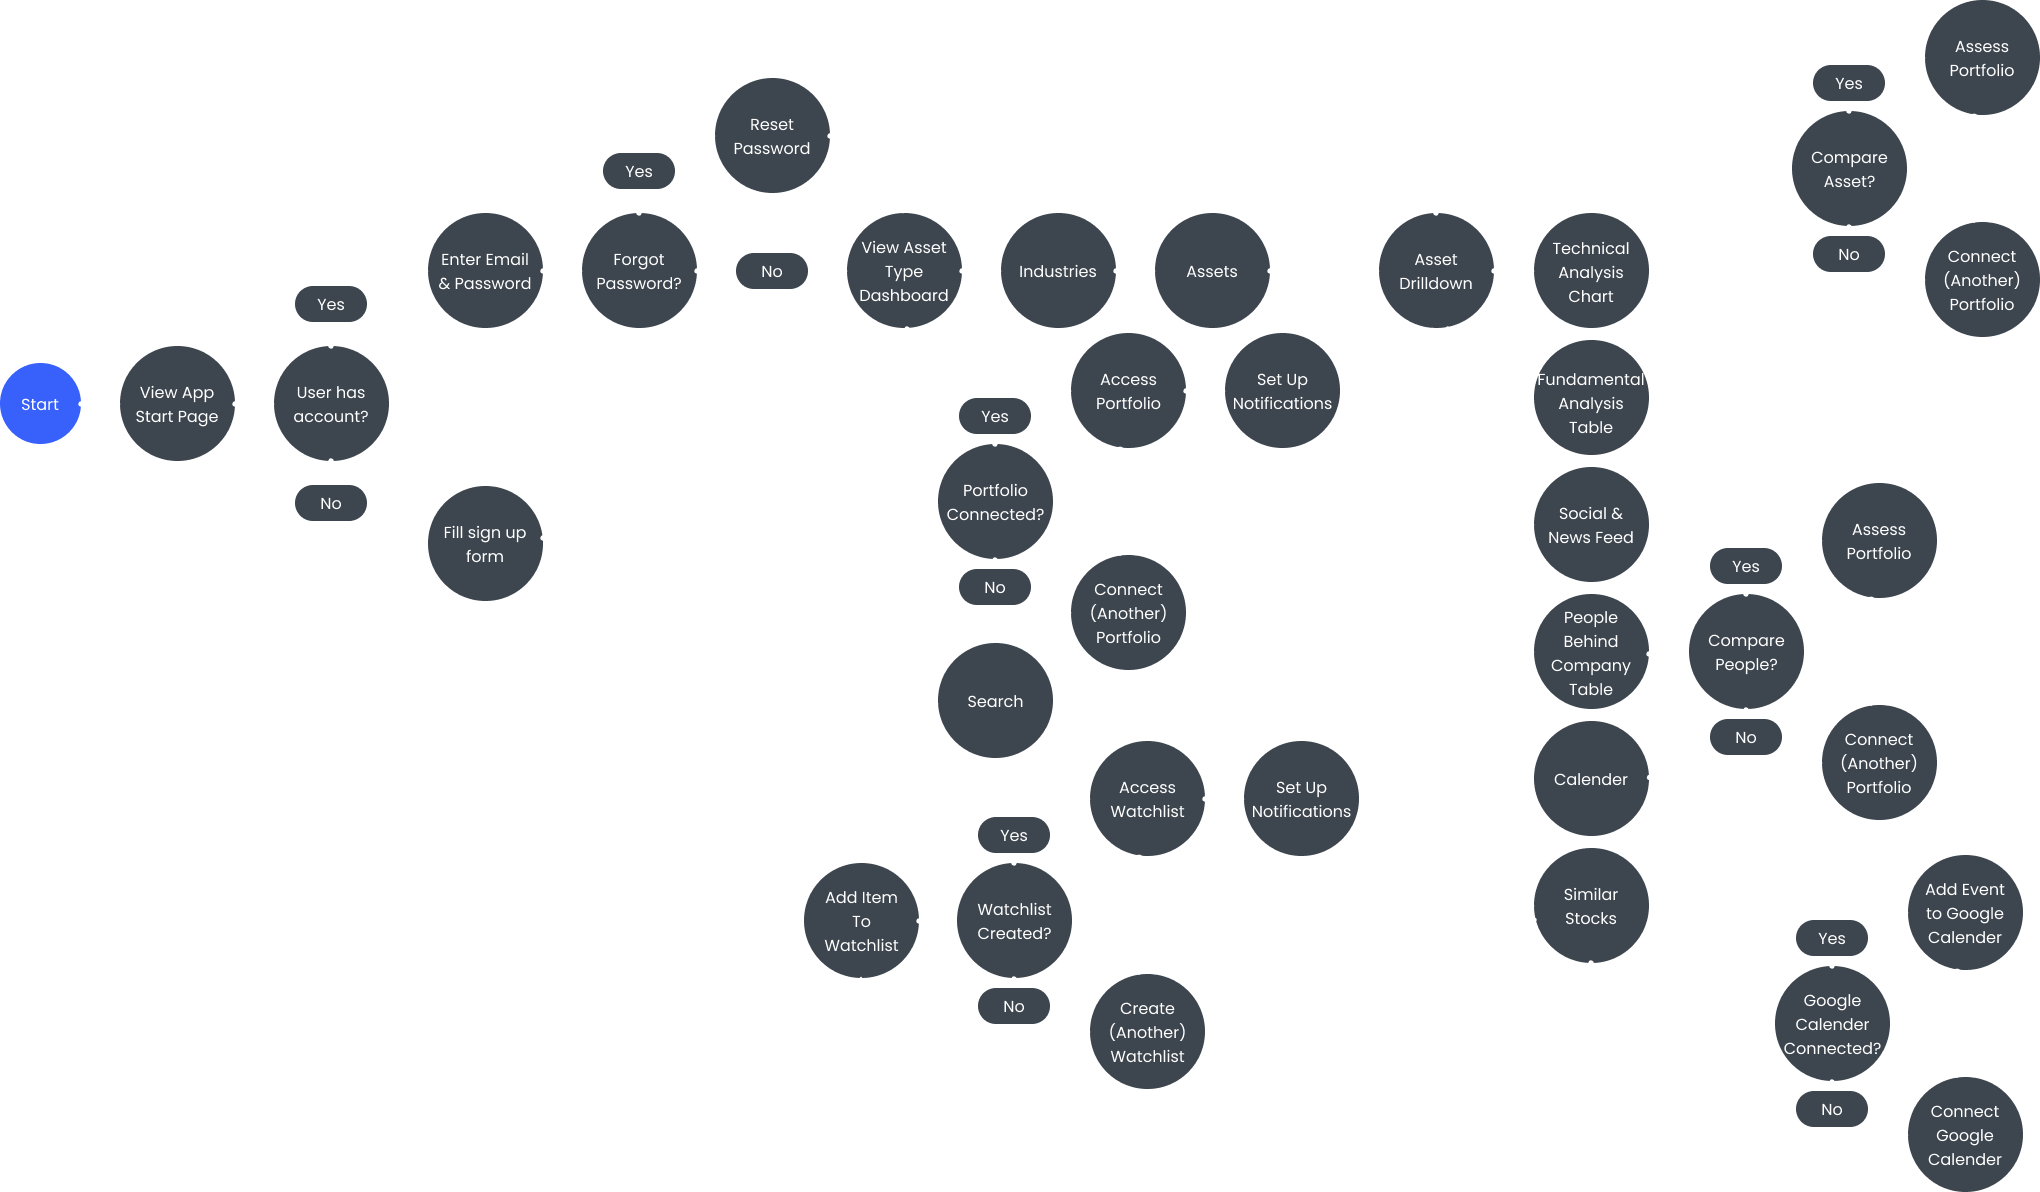
Some of the core user needs include ability to conduct the trading research within a single app, the ability to connect their portfolios, and set notifications about important events and price alerts.
Research Insights
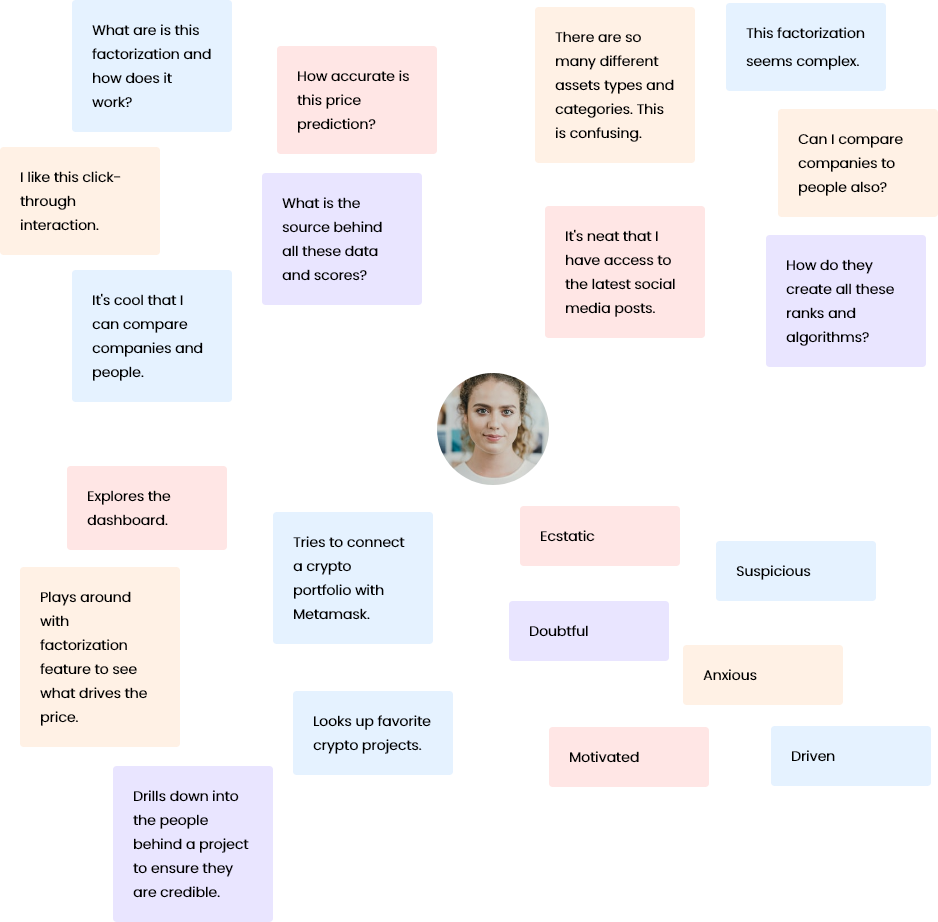
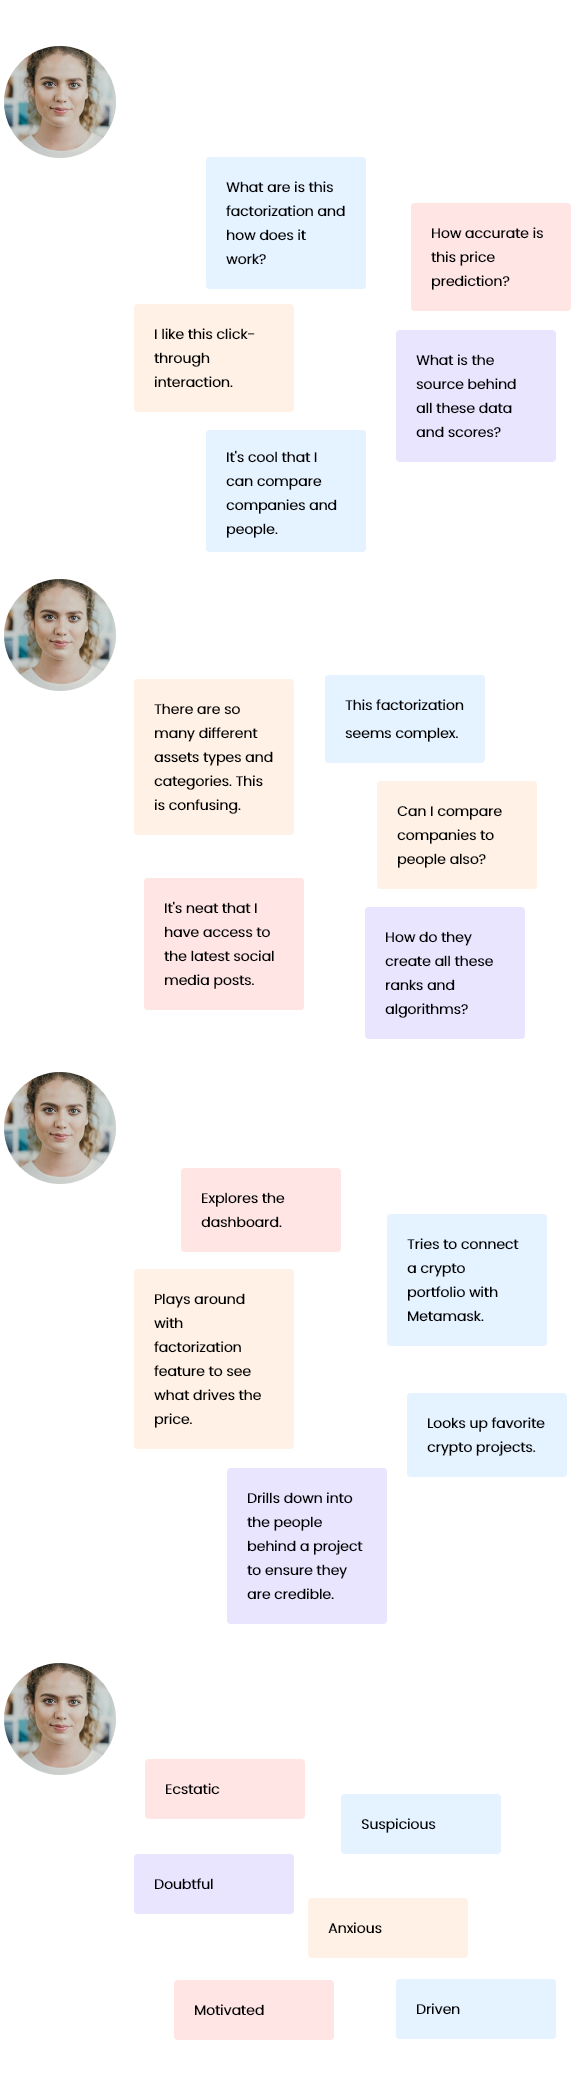
Upon conducting interview from people in the trading world, we found out that the majority of them would like to have access to a lot more information than we initially thought. Furthermore, they would to have credible source of information and to be assured of that. Therefore, it is important to showcase where and how the data is collected, so that the users would consider the app’s data credible and trustworthy.
Key Decisions
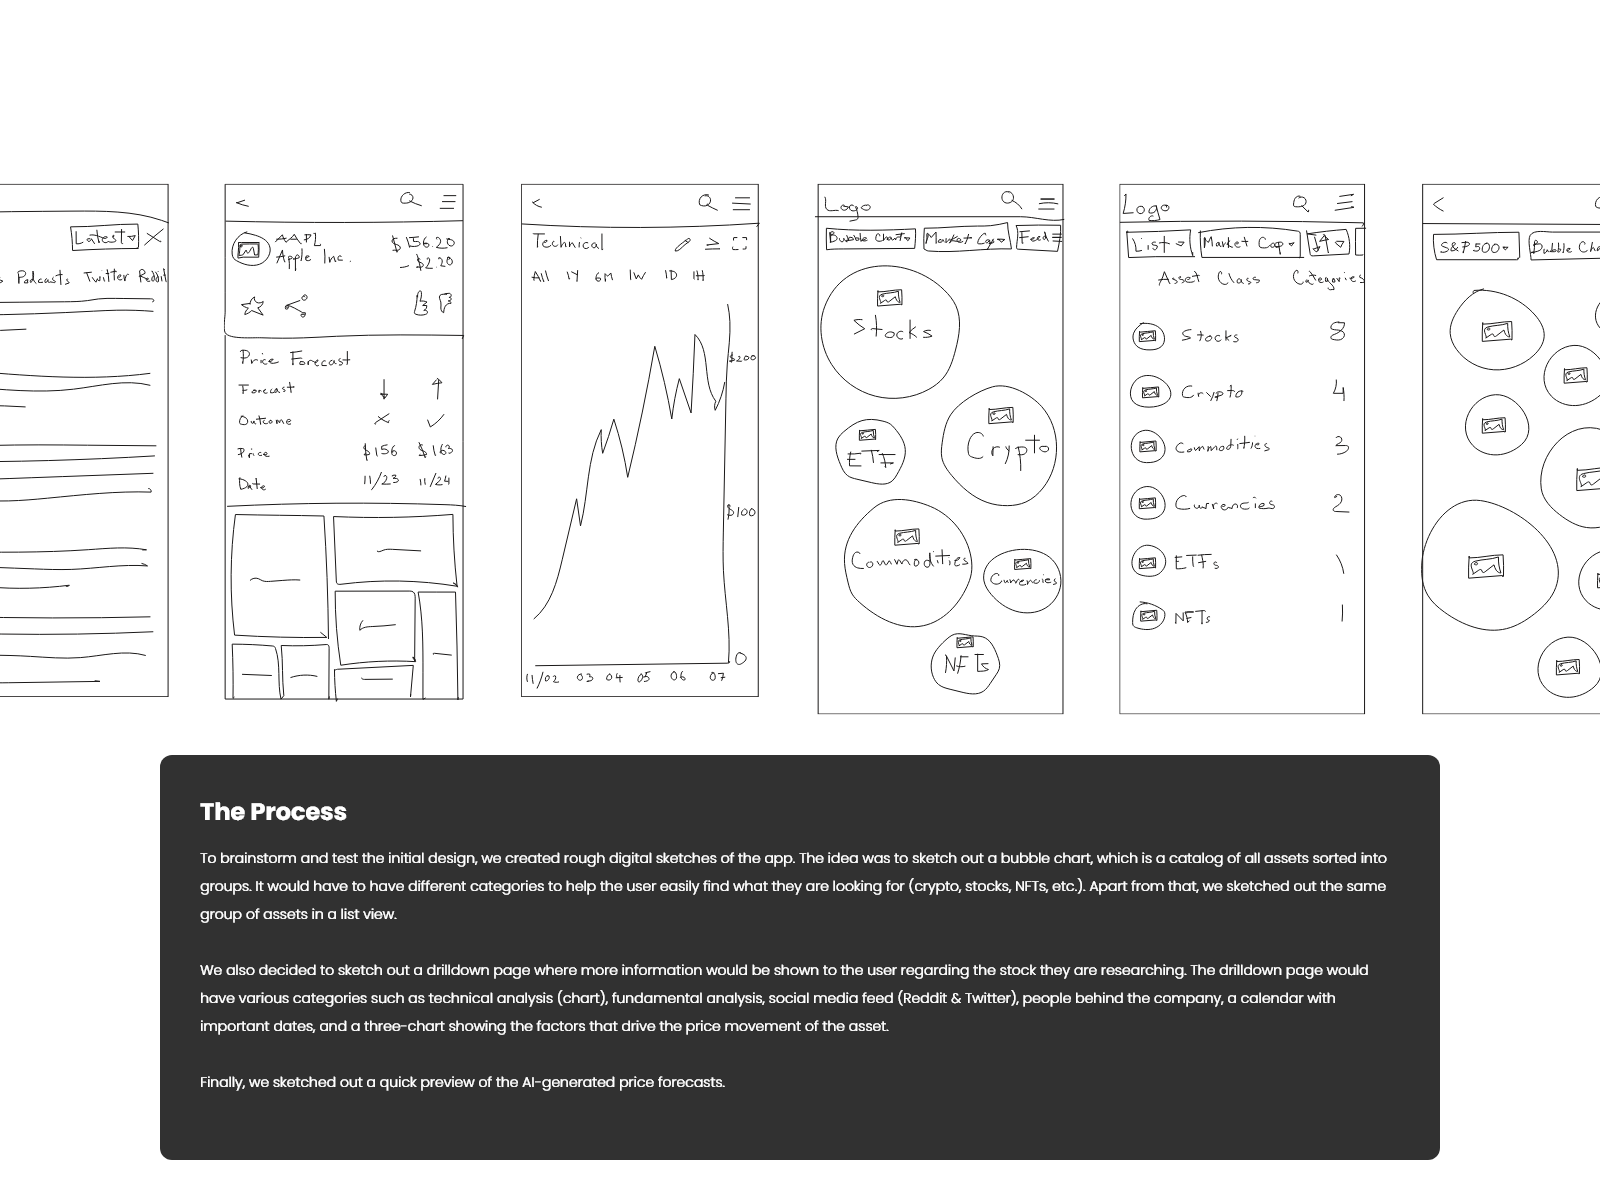
As a lot of APIs were in plan of being developed for the app, it was important to include the explanations and sources behind such data and the scores that were to be formed based on those (e.g., a CEO rank). In addition, to make the app easy to navigate, interactive three.js elements were to be introduced. Each asset would be represented as a bubble with a logo, name, and a ticker, and the size of the bubble size would change based on filters (e.g., stock A had a 24 hour trading volume of $20M, where the stock B had a volume of $10M. The size of the stock A should therefore be double that of the stock B).